Energy is Life
Don’t take it for granted. Use it to backstop your investments.
Don’t take it for granted. Use it to backstop your investments.
Historically water, food, and shelter are the foundations of life. But that has changed over the last 150 or so years.
Sourcing, processing and delivering water to your home requires energy. Farming, processing and transporting food to the store requires energy. Getting it home requires more. Heating, cooling, lighting, cooking, and food storage in your home requires energy. So, unless you can or do live ‘off the grid’ energy is now life.
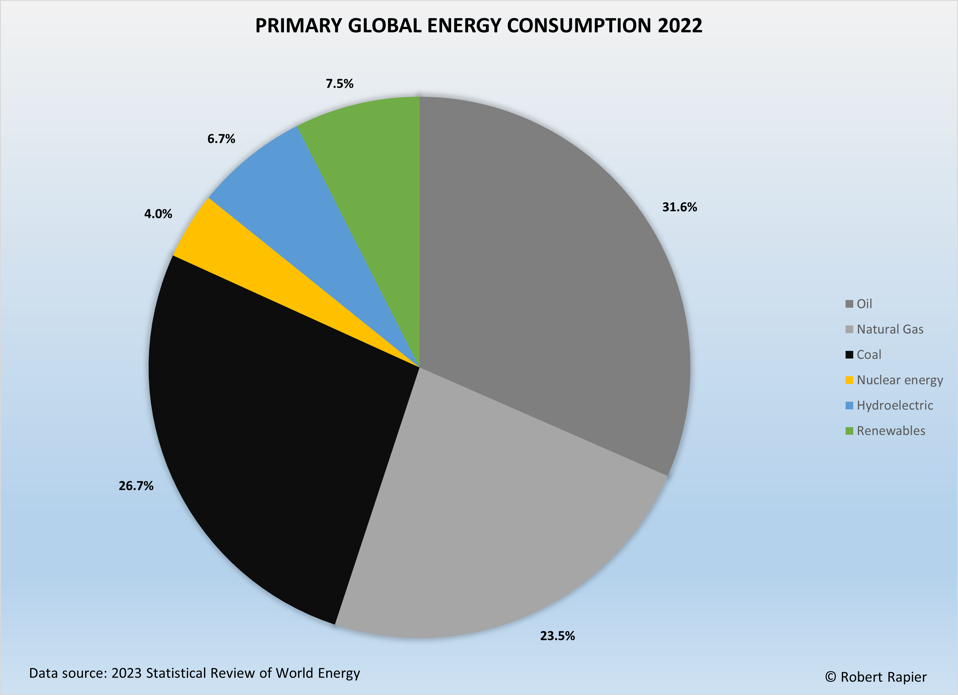
We may not like the fact that ‘dirty’ hydrocarbon energy sources - coal, oil and natural gas - remain over 81% of global consumption while nuclear and renewables increase over time. But we must acknowledge that we can’t live without these fossil fuels for the coming decades through this transition. With 10-20% of the world’s supply of oil and liquified natural gas impacted by the Iran war, just weeks from the wars’ outset, countries are beginning to encourage less energy consumption and planning for energy shortages should the war continue much longer.
We personally may be ok in Canada, bearing only higher fuel, food and flight prices, but with the Hormuz interruptions, portions of the world are close to abrupt shortage of life-giving energy. Do you think the citizens of Europe or Asia care about the source of energy when faced with a lack of energy? No. Blunt reality will reinforce energy is life.
So, what’s the point?
If energy is so fundamental to our existence, then it should also be a good investment.
In the previous blogs Fiat, Reset, Nothing Stops this Train and Debasement we reviewed various elements about how our fiat currencies are being devalued and will be reset in time. The direct impact of this process is the devaluation of bonds, which happen to be 40% of the typical person’s savings. For some decades bonds and the bond market were the safe haven relative to the more volatile stock market equities in a balanced portfolio.
I believe our energy transition away from hydrocarbons to nuclear and renewables will last more decades than the currency reset and related bond devaluation. For this reason, I believe energy, like other commodities, is a relatively better investment safe haven than bonds and bond markets. Since we practice what we preach, our investments include over 10% energy companies, including uranium, oil & natural gas producers. Be Prepared.
Great Power
America’s Empire is Declining. Where does that leave Canada?
America’s Empire is Declining. Where does that leave Canada?
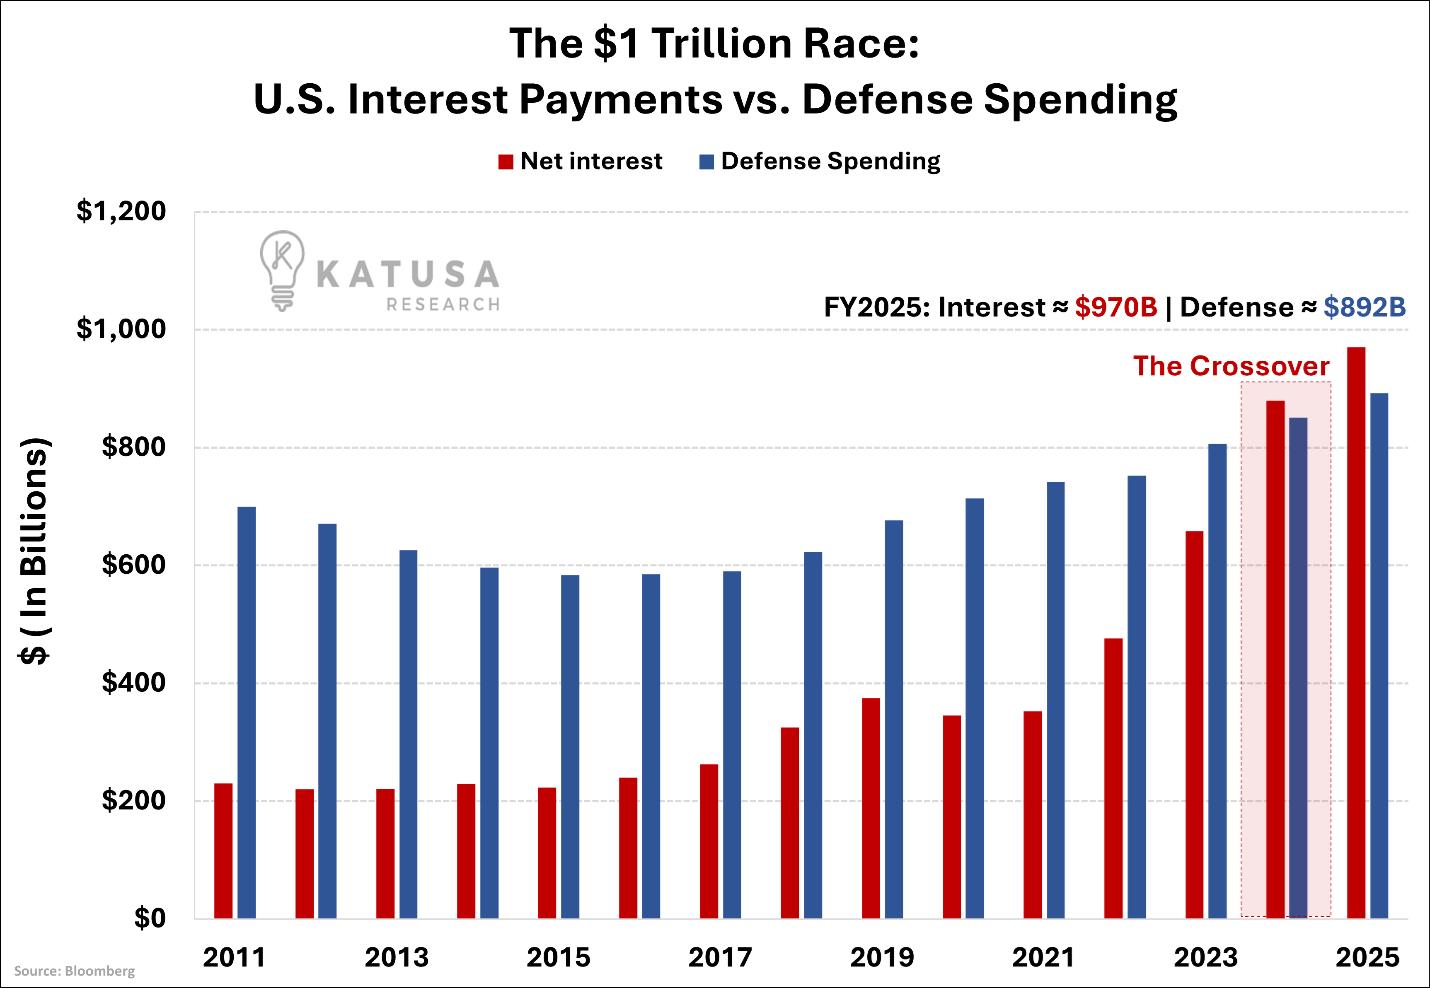
A social media post by Katusa Research includes this chart and a quote by historian and author Niall Ferguson saying "No great power has survived once debt servicing costs exceeded defense spending. Britain. Habsburg Spain. Now America."
The chart looks back fifteen years comparing the United States interest payments (red) against defense spending (blue). While defense dipped then returned to growth, interest has been climbing rapidly in the last few years, because of higher deficits combined with increased interest rates applied to the existing and new debts.
The chart and Ferguson’s quote echo the findings of Ray Dalio in his Principles for Dealing with the Changing World Order research and book. As discussed in History Rhymes (1), Dalio’s 500 years of research finds that a cycle of bad finances is one of the three primary reasons for change of great powers.
In their book Why Empires Fall, Peter Heather and John Rapley (2) make numerous references to excessive levels of government debt, often from war, as a relevant factor in the decline of an empire. They also point out as a great powers decline, the need for defense spending tends to increase as new rivals challenge the declining superpower. A vicious circle.
Ferguson, Dalio, Heather & Rapley provide us with three references to debt and interest as indicators of a great power (or empire) in decline. Will this crossover continue or reverse? It is common knowledge that the US government continues to run large deficits each year, growing their debt ever faster. Concurrently, interest rates remain elevated a few percent above the near zero lows of the 2010’s. Higher interest rates applied to servicing larger debts results in higher interest payments.
Could defense spending outpace the growth of interest payments and reverse the crossover? It could, however the vicious circle of increased defense spending is done with the use of deficits and debt to pay for it. I’d suggest the probability of the crossover permanently reversing is relatively small.
Decline does not necessarily mean the end of the US, rather a transition from a great power to a smaller, lesser power. Think of the British Empire, whose great power military and financial dominance waned after WW1 and dropped rapidly after WW2. Nonetheless, they remain, generations later, as a significant middle power on the global stage.
What does this mean for Canada?
Canada is a geographical neighbor to the world’s current great power. Prior to that we were a colony of the since-declined British Empire. What a favored, perhaps even spoiled, existence we’ve lived for some 200 plus years. We have benefited from the military and economic might of these great powers. This appears to be changing.
It is reasonable to assume that as the US declines, we will need to become more responsible to defend ourselves, grow our own economy and diversify our trade. There are early positive steps in these directions being taken by our government, their timeline measured in months. We as citizens and voters need to understand that for Canada to Be Prepared we need do our part to keep our country on the right path towards greater self-sufficiency through the coming decades.
1. History Rhymes, Be Prepared blog 8 July 2024, https://www.bepreparedcanada.net/
2. Why Empires Fall: Rome, America, and the Future of the West, Heather & Rapley, 2023
Mean Reversion
What is it and why does it matter?
What is it and why does it matter?
Regression to the mean is a statistical law where an unusually high or low measurement is likely to be followed by a measurement closer to the average (or geometric mean). Anyone remember this from Stats class?
Financial (stock) markets call this mean reversion. The financial markets apply this stats law as a trading theory that asset (stock) prices eventually revert to their long-term mean or average level. Basically, what goes up must come back down.
Standard Deviation
Within a statistical regression model, standard deviation (SD) measures the typical distance between observed data points and the (predicted) regression line, indicating model accuracy.
Stock Market Valuation
Moving from stats into stock markets, there are many recognized ways to place value on an individual company in the market. And by extension, the entire stock market can also be valued.
Methods of valuation include a comparison of company stock price to its earnings (P/E ratio), a cyclically adjusted company stock price to earnings (Cyclical P/E or CAPE ratio), company value to replacement cost of assets (Q ratio), and a simple look at a company’s stock price.
Keep in mind that company (and market) valuations are estimated true worth of a company (the entire market) while price is simply what an investor pays for a share at any given moment.
The Graph
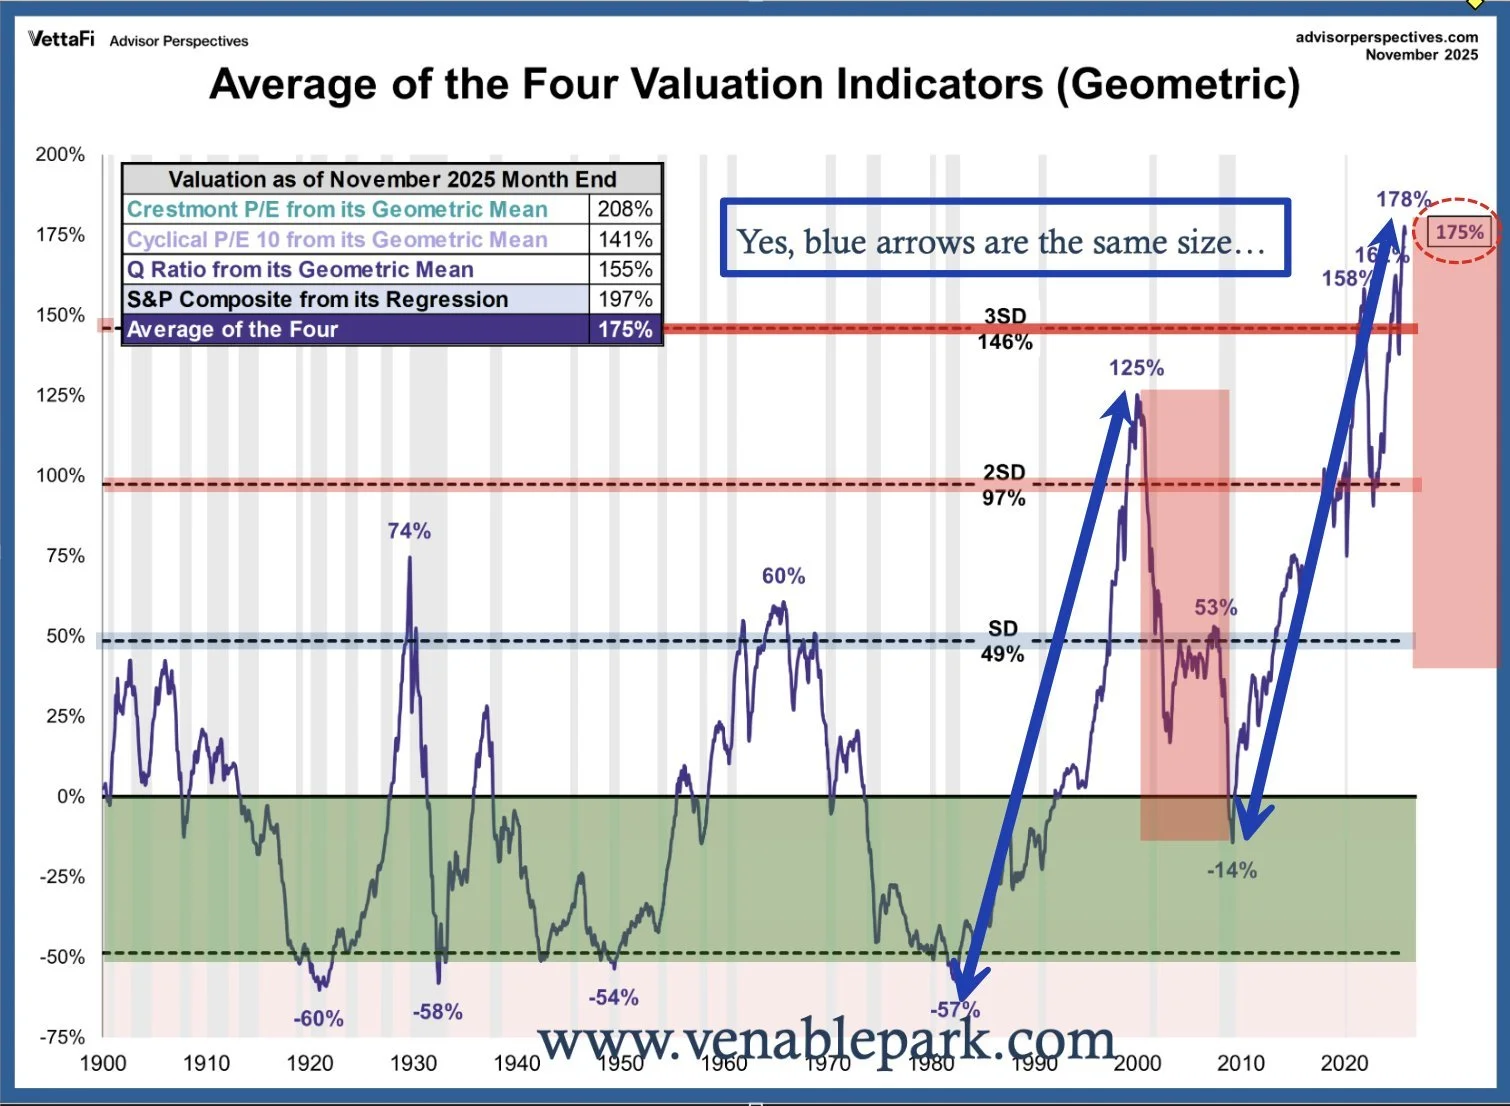
The busy graph provided as this blog’s image, complements of Venable Park (1), includes an average of four different stock market valuations covering a large data set, a period of 125 years. The X axis is in %, with the geometric mean identified as 0%. The horizontal lines represent standard deviations (SD) above and below the geometric mean. The vertical grey areas represent historical periods of recession. The pink areas represent the most recent valuation decline and speculation on the next decline. The blue arrows and comments are added by Venable Park.
What Does the Graph Tell Us?
About the Stock Market
· Four different valuation methods agree stock valuations are at all-time highs
· Mean reversion of stock valuations is increasingly likely
About the Last 50ish Years (2)
· Recessions have been much less common in my adult life
· Higher highs and higher lows are occurring. The mean will move up over time
These are all facts any financial advisor can look up and discuss with you. If they are primarily discussing the big gains from recent years and not looking at the coming year(s) mean reversion risk, I’d suggest you Be Prepared for what’s coming sooner than later and lead them into a risk discussion.
1. Venable Park Investment Council Inc,, a Canadian financial advisory firm
2. PS. The why for these last 50 years can be found in blogs including Fiat 25Oct24 and Debasement 21Oct25

1929
Does History Rhyme?
Does History Rhyme?
October 1929 is regarded as the start of the Great Depression. More specifically, the US and Canadian stock markets ended their huge run up and began their dramatic multi-year decline that fateful month. Andrew Ross Sorkin has recently released an historical book (1) of the key players and events surrounding this monumental time in North American financial history.
In promoting his book, Sorkin has appeared on many podcasts (2) (3) and always ends up discussing what was and can be learned from that crash and how it may be applied to our current situation. Let’s take a tour through the learnings and their applicable knowledge.
Then vs Now
Revolutionary changes were occurring in society like the advent of radio, the mainstreaming of automobiles, and public access to the stock market. Debt became a mainstream tool for the first time. The US was applying tariffs for protectionist reasons.
Governments were small and ran surpluses. Money was backed by gold. Financial, banking and stock market regulation barely existed. The stock market was essentially the wild, wild west of its time.
Income inequality was very high then. Buying into the stock market with leverage was the lottery ticket to get ahead in life.
Today
Income inequality is even higher today. The new lottery ticket is found in crypto and Mag 7 stocks. RCA then is the Nvidia of today. <see Name Notes>
Remarkable euphoria around technology that will change the world. AI and data centers today. Shocking high stock valuations are the result. And high valuations always lead to correction.
Concurrently, remarkable levels of debt are being leveraged to drive the technology investment. Private credit is where lots of today’s growing leverage is positioned, along with the corporations building the technology and the energy to power the data centers.
In Conclusion
Sorkin’s epilogue ends with:
“The enduring lesson is not that booms can be prevented or that busts can be fully averted. It is that we need to remember how easily we forget. The antidote to irrational exuberance is not regulation by itself, nor skepticism, but humility – the humility to know that no system is foolproof, no market fully rational, and no generation exempt. The greater the heights of our certainty, the longer and harder we fall.”
There is no certainty of a bust or timing for a bust. But, if history does rhyme, then it is signaling that stock market trouble is coming our way. Let’s Be Prepared and minimize the fall.
1. 1929: Inside the Greatest Crash in Wall Street History – And How it Shattered a Nation, Andrew Ross Sorkin, 2025
2. The New Yorker Interview, YouTube, November 2025
3. Principles by Ray Dalio, How Debt Drives Every Crash, YouTube, November 2025
Name Notes:
· Mag 7 stocks are Alphabet/Google, Amazon, Apple, Meta, Microsoft, Nvidia, Tesla
· RCA is Radio Corporation of America, created to control American Radio in the 1920’s
· Nvidia is a leader in manufacturing graphics processing units